How to buffer your plans for uncertainty
Don’t just double up your estimates, there is a more reliable approach

Today, many a project is a suitable fit for the agile methodology. Instead of promising to ship a fixed scope of features at a specific date at a pre-agreed price, we acknowledge that reality and requirements tend to vary over time and offer flexibility in one or several of those areas.
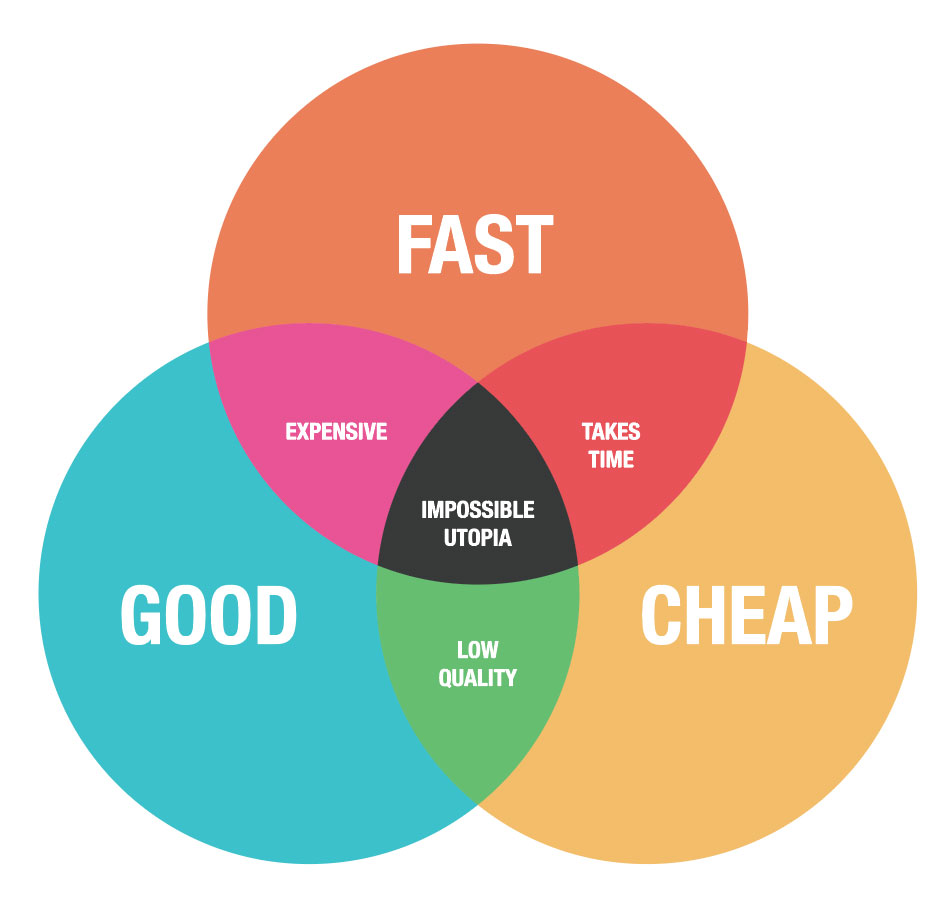
Doing this is, in essence, to acknowledge the ever-present elephant in the room in the world of project management: the iron triangle.
You have probably seen it before. We can deliver a project within a tight deadline, at a low price point, and with excellent quality — but never all three simultaneously. We are only allowed to pick two.
The beauty of agile is that it allows us to shift priorities as we learn more about the project, and the advantages are many:
- As a customer, we get the benefit of being allowed to change the requirements as we go.
- As a supplier, we don’t need to specify and document every meticulous detail upfront.
- The project financial risk becomes distributed more evenly between the client and the supplier.
Dealing with firm deadlines
But what if the circumstances demand a fixed scope and firm deadline? Just knowing that we will be generously compensated is not enough; we still need a way to ensure that we can deliver in time.
Throwing money and people on a project has failed more times than anybody cares to remember. And given the typical financial scarcity of the small business world, we are usually left to cope with whatever limited resources we have at our disposal anyway.
So what do we do?
The answer is to use buffers. These come in many flavors, like padded estimates from the actual makers or an added percentage of extra time added by the project manager.
And while this is what we will do here as well, we will take a slightly more scientific approach than relying on barebones gut feeling.
More specifically, we will utilize these two kinds of buffers:
- Feature buffer
- Project buffer
Let’s see what they have to offer.
A trip to the airport
To illustrate what they are and how we use them, picture yourself going to your best friend’s wedding, which takes place on another continent.
Your flight takes off at 18:00, and since one is generally supposed to reach the check-in counter 60 minutes before departure on international flights, you need to be at the airport before 17:00. Also, generally speaking, the boarding gate closes 15-30 minutes before departure.
Given that a taxi ride from your home to the airport usually takes 30 minutes and you would like to buy some magazines and snacks at the airport, the question is:
When should you leave home to make the flight?
Let’s break it down. Here are the activities and your estimates, based upon how long they usually take.
| # | Activity | Average duration |
|---|---|---|
| 1 | Taxi drive | 30 min |
| 2 | Walk from the taxi drop-off zone to the check-in area | 5 min |
| 3 | Check-in (needs to be completed by 17:00) | 20 min |
| 4 | Security | 20 min |
| 5 | Shopping | 30 min |
| 6 | Walk to the gate (needs to be completed by 17:30 - 17:45) | 10 min |
| Total duration: | 115 min |
Counting backward, you need to leave home at 15:50 at the very latest to make the flight. That is if you are the adventurous type. To play it safe with the boarding, you should go at 15:35.
Introducing the buffers
One way to tackle this uncertainty is to decide that you won’t shop for magazines unless you have the time.
This way, the #5 activity, Shopping, ends up in your feature buffer.
Buffering a project with features works the same way: we pad every delivery with no more than 70% must-have features and fill the rest with nice-to-haves. If the unexpected happens, we can safely ditch some of the latter, non-mandatory features.
In our example, this feature buffer gives us 30 minutes of padding, which might be enough to make the gate in time.
Trouble brewing
But what if the cab is late? Or if traffic is worse than usual? There might be congestion at the check-in or security. Or construction work, resulting in overall longer walks between the taxi drop-off and the gate. You might even need to visit the toilet without finding one.
Suddenly this 30-minute buffer feels a bit tight, so let’s re-estimate. This time considering the worst-case scenarios:
| # | Activity | Worst-case duration |
|---|---|---|
| 1 | The taxi driver is 30 minutes late and we get stuck in gridlock | 90 min |
| 2 | Walk from the taxi drop-off zone to the check-in area | 15 min |
| 3 | Check-in (needs to be completed by 17:00) | 60 min |
| 4 | Security | 60 min |
| 5 | Shopping (optional) | 0 min |
| 6 | Walk to the gate, including sudden bowel movements (needs to be completed by 17:30 - 17:45) | 30 min |
| Total duration: | 255 min |
With all these potential mishaps accounted for, we should order the taxi pickup at the whoppingly early 13:15.
This schedule might have been ok with us if we were to be Piglet, the anxious little friend of Winnie the Pooh.
But we are not. This amount of padding is just ridiculous for most of us, even for such an important event as your BF’s wedding.
It’s improbable that all of these delays will happen on any single trip, and we don’t really care if the individual activities get done in time — we just need to be checked in by 17:00 and reach the gate by 17:30.
In other words, we are only concerned with whether the overall chain of activities takes too long or not.
So - instead of introducing padding for each activity, we rely on an overall project buffer.
But how do we calculate it? Summing up the individual buffers didn’t work, so we need to find a better way.
Calculating the project buffer
The answer is called the Root Squared Error Method (RSEM), also known as Root Mean Square Deviation (RMSD), or more colloquially as "the square root of the sums approach."
Don’t be alarmed by the fancy names; while the method relies on mathematical statistics, the actual formula is not that hard to use. Just use Excel or something that has this capability built-in, as Flowmine soon will have.
But first, some background.
Have you ever heard of normal distribution and standard deviation? Or how they relate to mean values?
Normal distribution is the bell-shaped graph (shown below) that usually appears when statisticians map out various things involving humans and nature in general. It shows how the data points are spread around the mean value — the peak of the curve.
Standard deviation is a measure of how much an individual data point differs from the mean. It is shown on the x-axis in the diagram. The farther away from the peak, the less probable that data point becomes.
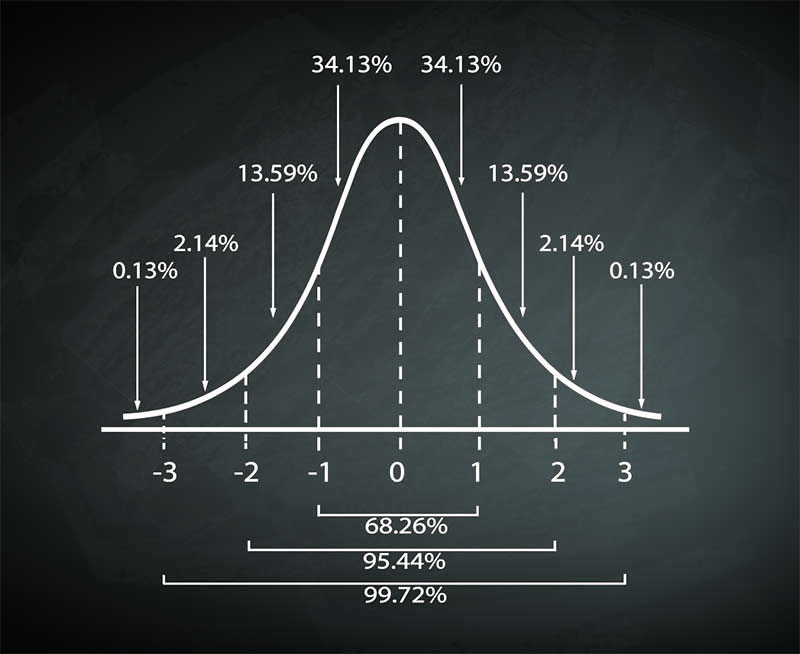
As we can see in the chart, most data points end up within about 68% of all data points. That holds true regardless of what we measure — whether we try to calculate the average height of the male bear population in Alaska, writer earnings on Medium, or estimates of activity completion time.
As it happens, these 68% equals one standard deviation. If we allow for two standard deviations, we include roughly 95% of all possible values.
Let’s go back to the airport example.
Our initial estimates represent the most probable result — the average, the mean, the peak of the bell curve. By providing another worst-case estimate that we are 95% certain of, the difference equals two standard deviations.
Thus, we suddenly have actual values to insert into the Root Squared Error Method formula, which looks like this in its simplified form:
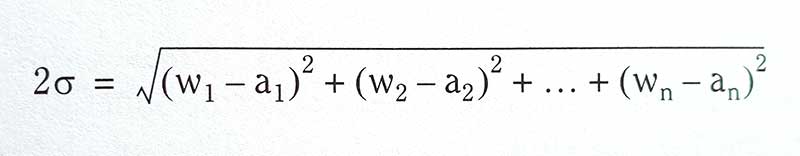
The letter σ is called sigma and represents one standard deviation. 2σ equals the project buffer.
In plain English, this means that we subtract each most probable (or average) estimate from its worst-case counterpart. Then we square the differences and sum them up. Finally, we pull the square root of the sum, resulting in our project buffer.
Enough talk, let me show you how we can calculate it:
| # | Activity | Average duration, an | Worst-case duration, wn | (wn - an)2 |
|---|---|---|---|---|
| 1 | The taxi driver is 30 minutes late and we get stuck in gridlock | 30 min | 90 min | 3600 |
| 2 | Walk from the taxi drop-off zone to the check-in area | 5 min | 15 min | 100 |
| 3 | Check-in (needs to be completed by 17:00) | 20 min | 60 min | 1600 |
| 4 | Security | 20 min | 60 min | 1600 |
| 5 | Shopping (optional) | 0 min | 0 min | 0 |
| 6 | Walk to the gate, including sudden bowel movements (needs to be completed by 17:30 - 17:45) | 10 min | 30 min | 400 |
| Totals: | 85 min | 255 min | 7300 |
The sum of the squares is 7300, and the square root of that equals about 85 — which means that our project buffer is 85 minutes.
If we add the buffer to our average estimate we get the expected total duration:
85 (average) + 85 (buffer) = 170 minutes
Why do we square the differences? It serves two purposes:
- In some result sets, the difference could be negative. By squaring, we ensure that we always get positive values.
- It gives more prominence to the larger differences. As the table shows, the "walk to check-in" activity hardly affects the total at all.
Enough theory — what is it good for?
In short, this method lets us acknowledge the known risks without stretching the timeline more than necessary.
In our example, this means that we can leave home at 14:40 — almost one and a half-hour later than what we got by summing up the worst-case estimates.
Would it be enough? Well, you decide. Nothing is certain, but you have the statistical upper hand using the root squared error method, as long as your estimates are reasonable.
And if the things we didn’t anticipate should occur, like a meteor strike or an alien invasion, we have more significant problems than a missed flight anyway.
Buffer guidelines
In the real world, things are a little more complicated and unpredictable than a trip to the airport. If you decide to try the root squared error method, make sure that you include at least ten features to increase the reliability.
The project buffer should represent at least 20% of the total project duration since a smaller buffer might not provide adequate protection. And for feature buffers, remember not to use up more than 70-80% of your available capacity for the mandatory features to have enough padding.
Final words
Most projects involve dealing with tremendous amounts of uncertainty, and as humans, we often fail to quantify it properly. We are susceptible to biases, like underestimating the risks involved in things we are familiar with, whereas we typically overestimate features taking us to unfamiliar territory.
Not to mention that we can only estimate the known unknowns. There will always be the risk of a black swan — the metaphor for the things we don’t know that we don’t know.
That said, mathematical statistics usually trump gut feeling. At least statistically speaking.