How to use the cone of uncertainty in your projects

Some weeks back, I wrote about some of the pitfalls of estimating your projects, such as group psychology, time prediction biases, and communication mismatches.
Apart from acknowledging these potential fallacies, I recommended two tactics:
- Break down the tasks into smaller parts to avoid the risk of oversimplifying the required effort
- Use time tracking data and old estimates for similar tasks to provide a better baseline
Task breakdown is always possible, but what if you don't have any previous data to rely on or if other factors have changed?
Historical values are typically most useful when the new project or task is similar to the previous one regarding team members, technology, domain, and tools.
If you don't have any historical values, or if any of those factors differ too much, we are better off providing estimates in ranges and probabilities instead.
The first method we can utilize for this is the so-called "cone of uncertainty:"
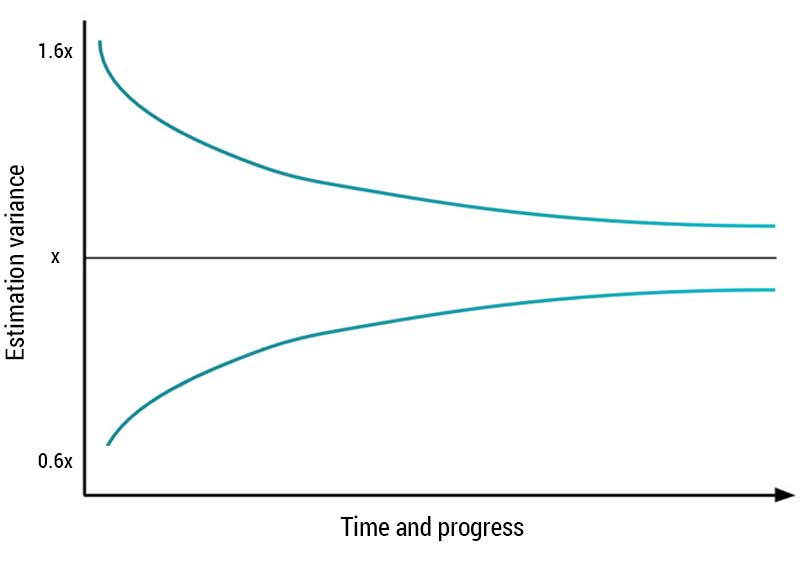
The graph describes the evolution of the amount of uncertainty during a project. In the beginning, we know little about the project or work results, so estimates become more uncertain. As more work is done, we learn more about the project, so the uncertainty decreases, approaching zero by the end of the project.
So how do we use it?
Well, if you have the chance, let your team run three or more iterations before communicating estimates and calculating the team's velocity.
Alternatively, you could again use the cone of uncertainty to approximate multipliers for the estimates in the initial iterations, like so:
| Iteration | Low multiplier | High multiplier |
|---|---|---|
| 1 | 0.6 | 1.6 |
| 2 | 0.8 | 1.25 |
| 3 | 0.85 | 1.15 |
| 4 and beyond | 0.9 | 1.1 |
While there is no solid scientific proof for this approach, it tends to work very well — and it makes sense to both team members and stakeholders.
With estimates made in calendar days, this is what it could look like:
| Iteration | Estimated days | Calculated range |
|---|---|---|
| 1 | 20 | 12 — 32 |
| 2 | 20 | 16 — 25 |
| 3 | 20 | 17 — 23 |
| 4 and beyond | 20 | 18 — 22 |
Use the ranges together with the project's critical path to come up with a total range, and adjust it as you learn more about the project.
Usually, it doesn't make sense to extend this approximation past four iterations. At that point, more is known about the project, the team is usually more confident and has achieved a higher level of interplay.
There are also other models we can use, like feature- and project buffers that I write about in this article.
How do you handle uncertainty in your projects? Drop me a line and let me know.